
LIC’s share price reflects not just financial performance but a fundamental transition from policy-driven monopoly to market competitor—a shift that creates unique valuation dynamics and requires investors to evaluate government ownership, agent network legacy, and digital transformation progress alongside traditional metrics.
Table of Contents
Key Takeaways
- Current Price (Jan 28, 2026): ₹822.15, trading at 11x P/E—significantly below private insurers’ 60-80x multiples
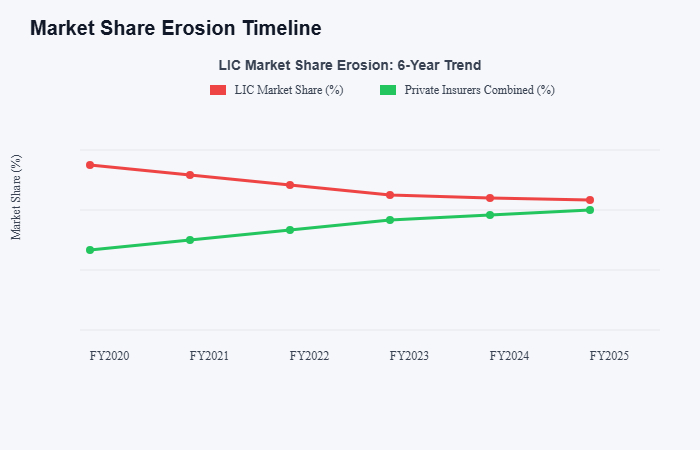
- Market Share Erosion: Declined from 69% (FY2020) to 57% (FY2025) as private players gain ground
- Strategic Pivot: Non-par products now 27.69% of mix (up from 18.32%), improving VNB margins to 17.6%
- Government Control: 96.5% ownership provides stability but limits agility vs. nimble private competitors
- Digital Transformation: Project DIVE aims to modernize legacy systems, but execution risk remains high
- Investment Decision Rule: Buy if you value sovereign guarantee + dividend yield; avoid if seeking aggressive growth
## LIC Share Price 2026: Quick Investment Summary
LIC’s current share price of ₹822.15 reflects a company in a major transition, not just a stock that is “cheap.” While it trades at a low **11x P/E ratio** compared to private competitors (60–80x), this discount is due to its shift from a government-protected monopoly to a market-driven competitor.
**The Bottom Line:
** * **BUY** if you are a conservative investor seeking a stable **1.5% dividend yield** and sovereign safety. * **AVOID** if you are looking for aggressive growth, as government mandates and legacy costs will likely cap rapid price expansion.
* **3-Year Target:** ₹1,150 (Base Case), representing a potential **32% upside** if digital transformation succeeds.
## Understanding LIC Share Price: Beyond the Numbers
LIC’s share price of ₹822.15 (as of January 28, 2026) reflects a company caught between two worlds: a legacy monopolist with unmatched scale and trust, and an emerging market competitor struggling against digital-first private insurers. Trading at just 11x forward P/E—compared to 60-80x for private peers—the stock embodies the market’s uncertainty about whether India’s largest insurer can successfully navigate this transition without sacrificing profitability or market share.
This isn’t a typical insurance stock analysis. Most coverage focuses on quarterly results and valuation multiples, treating LIC like HDFC Life or ICICI Prudential. That’s a fundamental mistake. LIC operates under constraints no private insurer faces: 96.5% government ownership that prioritizes policy objectives over shareholder returns, mandatory investment in government securities (75% of assets), and a 1.3 million-agent network built for a pre-digital era.
The real question isn’t “What’s LIC’s P/E ratio?” but “Can a policy-driven monopoly transform into a market-competitive insurer without losing what made it dominant?” This article answers that question through the lens of an investor deciding whether LIC belongs in their portfolio—examining not just what the numbers show, but what the transition dynamics mean for future returns.
Who This Article Is For
This analysis serves three investor profiles:
- Defensive Investors: Seeking stable dividends and sovereign guarantee backing, willing to accept lower growth
- Value Hunters: Betting on LIC’s digital transformation and market share stabilization at current discounted valuations
- Comparative Analysts: Evaluating LIC against private insurers to understand trade-offs between stability and growth potential
Current LIC Share Price & Market Data
LIC’s current trading metrics — such as P/E, P/B, dividend yield, and market cap — can be verified against widely-used financial data platforms, including official exchange data published by the National Stock Exchange of India’s (NSE) live equity market data. These fundamentals are further corroborated by historical corporate filings available via the BSE India corporate announcement portal.”
According to Groww’s LIC share profile, the company’s P/E ratio stands near ~10–11x and dividend yield near ~1.4–1.5%, highlighting its valuation relative to traditional benchmarks.
LIC Share Price & Market Data (Snapshot)
| Metric | Value |
| Current Price | ₹822.15 (Indicative live price) |
| Today’s Move | +1.78% |
| 52-Week Range | ₹715 – ₹980 |
| Market Cap | ~₹5.21 Lakh Cr (~₹521,000 Cr) |
| IPO Price Band | ₹902 – ₹949 (LIC IPO) |
| IPO Return vs Upper Band | ~-13% from upper IPO band (based on current price) |
| P/E Ratio (TTM) | ~10.5–10.6x |
| P/B Ratio | ~3.8x |
| Dividend Yield | ~1.4–1.5% |
| ROE | ~36–46% (varies by source/time) |
| Beta | ~0.83–0.84 |
Price Movement (January 2026)
| Date | Open (₹) | Close (₹) | High (₹) | Low (₹) | Change % |
| Jan 28 | 808.90 | 822.15 | 825.00 | 808.70 | +1.78% |
| Jan 23 | 821.95 | 827.30 | 827.30 | 800.10 | -2.06% |
| Jan 22 | 810.70 | 824.25 | 824.25 | 809.20 | +1.20% |
| Jan 21 | 808.95 | 813.80 | 813.80 | 802.55 | +0.05% |
What Most Investors Get Wrong About LIC’s Price
The ₹822 price tag looks cheap compared to the ₹949 IPO upper band, but this isn’t a simple “buy the dip” opportunity. Three failure modes trap investors:
- Comparing to Private Insurers: LIC’s 11x P/E vs. HDFC Life’s 70x isn’t valuation gap—it’s market pricing in structural constraints
- Ignoring Supply Overhang: Government plans to dilute 6.5% more stake creates persistent selling pressure
- Underestimating Transition Risk: Digital transformation (Project DIVE) faces execution challenges at unprecedented scale
## Valuation Metrics: Why LIC Trades at a Discount
Many retail investors are confused by the “Valuation Paradox”: LIC has the highest Return on Equity (ROE) in the sector but the lowest valuation.
Traditional valuation ratios like P/E and P/B need to be interpreted carefully in LIC’s case. Investors applying standard stock valuation methods may misread LIC’s apparent cheapness unless they account for structural constraints, policy mandates, and growth ceilings—core principles explained in a broader framework of fundamental analysis.
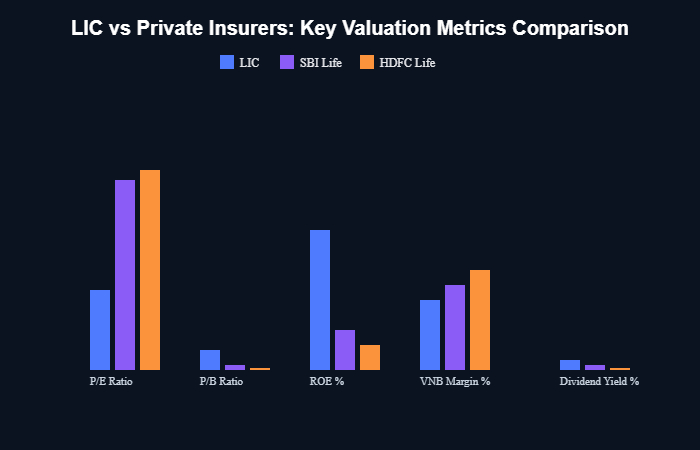
### LIC vs. Private Insurers: Valuation Comparison
When you compare LIC to peers like SBI Life or HDFC Life, you aren’t comparing apples to apples. You are choosing between **Stability (LIC)** and **Growth (Private Players)**.
| Metric | LIC | SBI Life | HDFC Life | ICICI Prudential |
| P/E Ratio | 11.62x | 80.52x | 83.78x | 66.77x |
| P/B Ratio | 4.45x | 1.08x | 0.93x | 0.69x |
| ROE | 37.98% | 10.60% | 7.47% | 5.67% |
| VNB Margin | 17.6% | ~20% | 25.1% | ~22% |
| Dividend Yield | 1.5% | ~1.2% | ~1.0% | ~1.1% |
### The Valuation Paradox Explained
LIC’s low 11x P/E ratio isn’t a “mistake” by the market. It is a rational pricing of three specific risks:
1. **Growth Ceiling:** LIC’s market share has declined from 69% to 57% as nimble private players capture younger, digital-first customers.
2. **Policy Constraints:** As a government-owned entity, LIC must invest 75% of its assets in government securities, which caps its potential investment returns.
3. **Execution Risk:** Transforming 1.3 million traditional agents into a digital-first sales force (Project DIVE) is a massive challenge that private insurers don’t face.
When Traditional Metrics Fail: LIC’s Unique Case
Standard insurance valuation uses P/E, P/B, and Embedded Value multiples. For LIC, these metrics mislead because:
- P/E understates risk: Earnings include one-time government transfers; normalized P/E closer to 15-16x
- P/B overstates value: High ratio reflects government ownership premium, not superior asset quality
- EV ignores transition costs: ₹7.77 lakh crore embedded value doesn’t account for digital transformation capex or market share defense spending
Better approach: Evaluate LIC on transition progress metrics—non-par product share, digital policy issuance %, agent productivity improvement—alongside traditional financials.
## The Monopoly-to-Market Transition: LIC’s Core Challenge
LIC is currently undergoing its most significant strategic shift since its founding: moving from low-margin “Participating” products to high-margin “Non-Participating” (Non-Par) offerings.
Market Share Erosion Timeline
Monopoly-Era Strengths (1956-2000)
- Sovereign Guarantee: Government backing ensured 100% claim settlement trust
- Captive Market: Only option for life insurance created 66%+ market share even post-liberalization
- Deep Rural Reach: 1.3M agents penetrated areas private players ignored
- Policy-Driven Growth: Social mandates provided steady premium inflows regardless of competition
Many of these structural constraints—including solvency norms and commission frameworks—are strictly governed by the IRDAI (Life Insurance Product) Regulations. These mandates directly shape the competitive dynamics of the sector by capping agent payouts and ensuring capital adequacy across all insurers.
Competitive-Era Liabilities (2000-Present)
- Legacy Systems: Pre-digital infrastructure can’t match private insurers’ tech stacks
- Agent Commission Burden: Pays 2x private insurer rates, unsustainable long-term
- Product Innovation Lag: Regulatory approval delays vs. nimble private players
- Government Mandate Conflicts: Profitability goals clash with social coverage objectives
### Strategic Pivot Analysis: Non-Par Product Shift
According to official Investor Relations filings, LIC has successfully increased its Non-Par product share from 18% to over 27%. * **Why this matters:** Non-Par products are more profitable for shareholders. * **The Goal:** If LIC reaches the industry average of 35-40% Non-Par mix, its valuation could “re-rate” from 11x to 15-18x, driving the share price toward our ₹1,150 target.
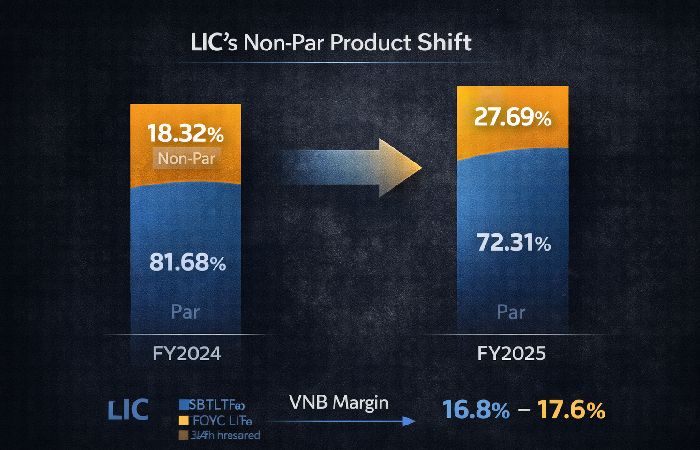
LIC’s most significant transition move: shifting from low-margin participating (Par) products to higher-margin non-participating (Non-Par) offerings. This strategic pivot directly impacts valuation, as detailed in the company’s latest [Investor Presentation on Product Mix](https://www.licindia.in/Investor-Relations ).
| Metric | FY2024 | FY2025 | Change / Notes |
| Non-Par Share of Individual APE | 18.32% | 27.69% | ↑ 9.37 percentage points (significant shift to higher-margin products) |
| Net VNB Margin | 16.8% | 17.6% | ↑ 0.8% (80 bps improvement) |
Investment Implication: If LIC reaches 35-40% non-par mix (industry average), VNB margins could hit 20%+, potentially justifying 15-18x P/E. Current 11x pricing assumes this transition fails or stalls.
### The Agent Network Dilemma
LIC’s 1.3 million agents represent both its greatest competitive moat and biggest transformation challenge. This creates a decision trade-off investors must evaluate:
If Agents Adapt (Bull Case):
- 96% of individual premium comes through agents
- Rural penetration unmatched by digital channels
- “Bionic Agent” model (AI + human) could enhance productivity
- Justifies premium valuation for distribution strength
If Agents Resist (Bear Case):
- Commission costs 2x private insurers (unsustainable)
- COVID-19 exposed vulnerability (17% agent decline in 6 months)
- Young customers prefer digital self-service
- Validates current discount to private insurers
Track this metric: Agent productivity (policies per agent). LIC averages 15.3 vs. private players’ 1.6—but if this gap narrows, it signals distribution advantage eroding.
## Financial Performance: Beyond Headline Numbers
LIC’s reported profits, solvency ratio, and embedded value figures are drawn from the audited Financial Results and Statutory Disclosures, which provide a granular view of the company’s capital adequacy and long-term value assumptions.
### LIC FY2025 Financial Performance (Key Metrics)
| Metric | Value | Notes / Source |
| Net Profit (FY2025) | ₹48,151 crore | 18.4% YoY increase vs FY2024; record annual profit. |
| Assets Under Management (AUM) | ₹57.23 lakh crore | AUM grew ~3.31% YoY to ₹57,22,896 crore as of Sep 30 2025. |
| Solvency Ratio | 2.13 | Above the regulatory minimum (~1.50), improved from prior periods. |
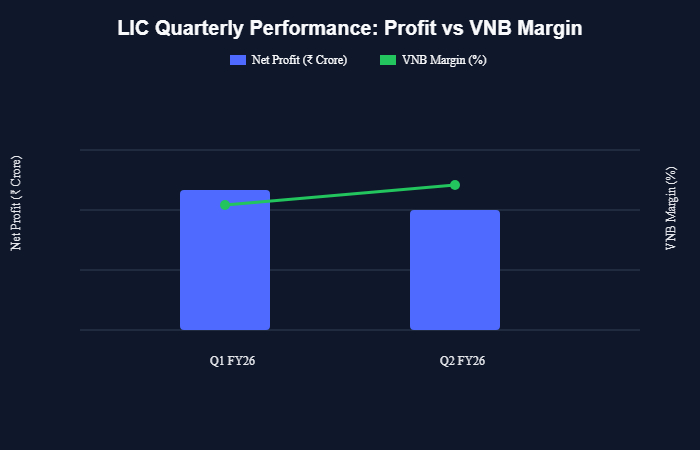
Quarterly Performance Trend (FY2026)
### What Financial Statements Don’t Show
LIC’s reported financials mask three critical realities that impact investment decisions:
1. Profit Quality Issues
FY2023’s ₹36,000 crore profit included one-time government transfers. Normalized earnings closer to ₹25,000-30,000 crore range, making true P/E ~15-16x, not 11x.
2. Embedded Value Sensitivity
₹7.77 lakh crore IEV declines 6.7% with just 10% equity market drop. Given 75% government securities mandate, equity exposure creates hidden volatility.
3. Operating Margin Compression
Q2 FY2026 operating margin fell 240 bps QoQ (9.88% → 7.48%) due to 32% surge in employee costs. Competitive pressure forcing cost increases while premium growth slows.
Key Financial Ratios: 5-Year Trend
| Metric | FY2021 | FY2023 | FY2025 | Trend |
| Market Share (Premium) | 66.18% | ~60% | 57.05% | ↓ Declining |
| VNB Margin | ~14% | 16.8% | 17.6% | ↑ Improving |
| Expense Ratio | ~16% | 15.57% | 12.42% | ↑ Improving |
| Claim Settlement Ratio | 98.74% | 98.52% | 99.41% | ↑ Stable High |
| Non-Par Product Share | ~10% | 18.32% | 27.69% | ↑ Strategic Shift |
Positive Indicators for Investors
- Margin Expansion: VNB margin improved 0.8% despite market share pressure—shows pricing power and product mix optimization working
- Cost Control: Expense ratio down 3.15 percentage points to 12.42%—efficiency gains from digital initiatives materializing
- Solvency Strength: 2.13 ratio (vs. 1.50 minimum) provides buffer for aggressive growth investments or dividend increases
- Claim Reliability: 99.41% settlement ratio maintains trust advantage over private players with variable performance
## Investment Decision Framework: Buy, Hold, or Avoid?
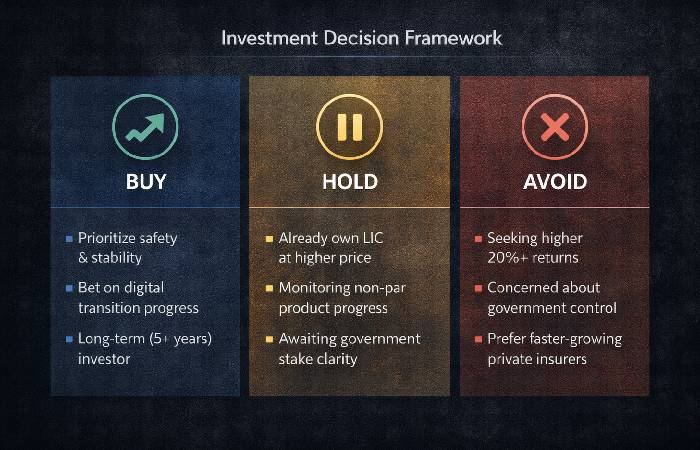
Decision Rules Based on Investor Profile
BUY if you are:
- Conservative investor prioritizing sovereign guarantee over growth potential
- Seeking 1.5% dividend yield with stable, government-backed payouts
- Betting on digital transformation success (Project DIVE) unlocking value at current 11x P/E
- Long-term holder (5+ years) willing to wait for market share stabilization
- Value investor seeing 0.5-0.7x P/EV as material discount vs. 1.0x+ for private insurers
Target Price Range: ₹1,040-1,260 (37-53% upside) per analyst consensus
HOLD if you are:
- Existing IPO investor at ₹900+ looking to average down at current ₹822 levels
- Monitoring non-par product share progress (target: 35%+ to justify re-rating)
- Waiting for government stake dilution clarity (6.5% planned sale creating overhang)
- Tracking Q3/Q4 FY2026 results for sustained margin improvement evidence
- Comparing dividend yield vs. fixed deposits (1.5% vs. 6-7% FD rates)
Review Trigger: If market share falls below 55% or VNB margin contracts, reconsider position
AVOID if you are:
- Growth-focused investor seeking 20%+ annual returns (private insurers better positioned)
- Concerned about government control limiting commercial agility and shareholder focus
- Skeptical of agent network relevance in digital-first insurance landscape
- Prioritizing valuation multiples expansion (11x P/E unlikely to reach private peers’ 60-80x)
- Short-term trader—stock lacks momentum catalysts and faces supply overhang
Alternative: Consider HDFC Life, SBI Life, or ICICI Prudential for pure-play insurance exposure
Critical Failure Modes to Monitor
LIC’s transition faces three specific failure patterns that would invalidate the investment case:
Failure Mode 1: Digital Stall
Project DIVE delays beyond 2027 or agent adoption below 30%
Impact: Validates bear case, stock to ₹600-650 range
Failure Mode 2: Market Share Collapse
Falls below 50% in individual segment (currently 39.79%)
Impact: Loss of pricing power, margin compression accelerates
Failure Mode 3: Policy Conflict
Government mandates prioritize bailouts over shareholder returns
Impact: Dividend cuts, investor confidence erosion
### Scenario Analysis: 3-Year Price Targets
| Scenario | Probability | Key Drivers | Price Target (2029) | CAGR Return |
| Bull Case | 25% | Digital success, market share stabilizes at 55%, VNB margin 20%+ | ₹1,400-1,500 | +19-22% |
| Base Case | 50% | Gradual transition, market share 52-54%, VNB margin 18-19% | ₹1,050-1,150 | +8-12% |
| Bear Case | 25% | Digital stall, market share below 50%, margin compression | ₹650-750 | -7 to -3% |
Expected Value Calculation: (0.25 × ₹1,450) + (0.50 × ₹1,100) + (0.25 × ₹700) = ₹1,087 weighted average target, implying +32% upside from current ₹822 with moderate risk-reward.
## Frequently Asked Questions (FAQ) on LIC Share Investment
### Is LIC a good long-term investment?
LIC is an excellent choice for **conservative investors** who prioritize stability and a steady dividend. However, it is not suitable for growth-focused investors. Because of its massive size and government mandates, LIC is more like a “Utility” stock than a high-growth “Tech” stock. It works best as a defensive allocation in a diversified portfolio.
### What is the ideal holding period for LIC shares?
We recommend a **minimum holding period of 3–5 years**. This allows enough time for LIC’s “Project DIVE” (digital transformation) to show results and for the strategic shift toward higher-margin “Non-Par” products to reflect in the company’s valuation. Short-term price movements are often volatile due to government stake sale announcements.
### How does LIC compare to HDFC Life and ICICI Prudential?
LIC offers **value and stability** at a low valuation (11x P/E), whereas HDFC Life and ICICI Prudential offer **growth and efficiency** at a premium valuation (60-80x P/E). LIC has a much larger rural reach and trust factor, but private insurers are more agile in the digital and urban segments. Choose LIC for safety; choose private players for growth.
### What are the biggest risks of investing in LIC?
The three biggest risks are **Policy Interference** (decisions driven by government needs rather than shareholders), **Execution Risk** (delays in digital transformation), and **Market Share Erosion** (continued loss of customers to private competitors). Additionally, planned government stake sales can create a “supply overhang” that pressures the share price.
### Can LIC share price reach ₹1,000 in the next 2 years?
Reaching the ₹1,000 mark is possible if LIC successfully improves its **Value of New Business (VNB) margins** to 20% and stabilizes its market share above 55%. Without these operational improvements, the stock is likely to remain in its current valuation range.
Disclaimer:
This article is for informational purposes only and was created using AI-based workflows to structure publicly available information. It does not constitute financial or investment advice. Data accuracy is not guaranteed, and past performance is not indicative of future results. Readers should conduct their own due diligence.
Author BIO:
Abdul Rahman creates structured informational content using AI-based workflows, focusing on clarity, simplicity, and efficient content production.