
As of late January 2026, Apollo Micro Systems share price trades at ₹253.20, reflecting a premium valuation of 107.54x P/E. At this level, the stock is not supported by current earnings and is pricing in aggressive future growth and near-perfect execution.
Whether this valuation becomes justified by 2026 depends entirely on how quickly earnings scale up over the next few years. The analysis below evaluates this through bull, base, and bear case scenarios, as Apollo remains a forward-expectation stock rather than a valuation-comfort play.
This matters because while the “Defense Growth Story” is real, the stock is priced for perfection compared to peers trading at 60–80x earnings. In this article, you’ll learn whether the company’s monopoly in “Electronic Fuses” truly validates this premium or if a valuation correction is inevitable.
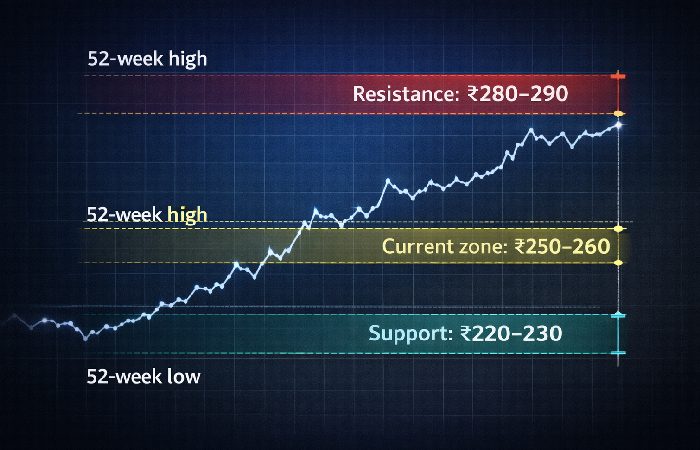
Table of Contents
## Background: From Sub-Systems to Mission Critical
Apollo Micro Systems (AMS) was incorporated in 1997, but its trajectory has evolved significantly in the declared Atmanirbhar Bharat era. From its origins as a sub-systems manufacturer, the company has developed into a trusted supplier and development partner to key Indian defence and space organisations, including DRDO, the Indian Navy, and ISRO.
The company specializes in mission-critical electronics—components that simply cannot fail. Unlike general electronics manufacturers, AMS builds ruggedized systems designed to withstand extreme G-forces and elevated temperatures for missile and naval programs. The shift from being a component supplier to a Development-cum-Production Partner (DcPP) has enabled participation in larger-ticket orders, including a recent ₹25.79 crore win where the company was declared the L1 bidder by a Defence PSU.
The company reported an order book of approximately ₹7,850 crore, providing multi-year revenue visibility, largely driven by defence and government programs. This order book reflects the company’s increasing participation in higher-value and longer-cycle defence projects.
## Core Business Segments
Apollo Micro Systems is engaged in high-performance electronic and electro-mechanical solutions across:
- Defence: Electronic systems and sub-systems for missile programs, naval platforms, battlefield electronics, and weapon system applications
- Space: Electronic systems and sub-systems for satellite, launch vehicle, and payload checkout applications
- Homeland Security: Surveillance and secure communication systems supplied as part of government and defence programs
- Industrial: Specialised electronic components and, through subsidiary operations, industrial explosives solutions
### Company Evolution & Milestones
Apollo Micro Systems’ journey reflects systematic capability building across defence and aerospace electronics:
- 1997: Incorporated as Apollo Micro Systems Limited
- Early Years: Entered the defence electronics segment with processor board and sub-system manufacturing
- 2000: Supplied an indigenous Payload Checkout System for ISRO, supporting localisation of critical space electronics
- 2004: Achieved ISO 9001 and defence quality certifications for design and manufacturing
- 2017: Converted into a Public Limited Company, enabling access to capital markets
- 2021: Expanded into RF and microwave design capabilities through acquisition
- 2024: Inaugurated the Integrated Plant for Ingenious Defense Systems (IPiDS) in Hyderabad. The IPiDS facility supports manufacturing scale-up, system-level integration, and execution of complex defence programs.
- 2025: Acquired IDL Explosives Limited, expanding the group’s presence in industrial explosives through subsidiary operations and diversifying its industrial segment exposureApollo Micro Systems Share Price Target 2026:
## Bull, Base & Bear Scenarios
### Bull Case Scenario
Assumptions:
- Revenue CAGR of 35–40%
- Net profit CAGR of 45% or higher
- Strong defence order inflows with timely execution
- Operating leverage leading to margin expansion
Estimates:
- FY26 EPS: ₹6.5 – ₹7.0
- Justified P/E Multiple: 45–50×
Implied Share Price by 2026:
- ₹325 – ₹350
In this scenario, the current premium valuation is justified as earnings scale
rapidly and the P/E ratio compresses through profit growth rather than price correction.
### Base Case Scenario
Assumptions:
- Revenue CAGR of 22–25%
- Net profit CAGR of 25–28%
- Normal execution with occasional delays
- Gradual improvement in operating margins
Estimates:
- FY26 EPS: ₹4.2 – ₹4.6
- Fair P/E Multiple: 28–32×
Implied Share Price by 2026:
- ₹120 – ₹145
In this scenario, earnings grow steadily but the stock offers limited upside,
as the current price already discounts much of the expected growth.
### Bear Case Scenario
Assumptions:
- Revenue CAGR of 12–15%
- Execution delays in defence projects
- Margin pressure and slower profit growth
- Valuation de-rating by the market
Estimates:
- FY26 EPS: ₹2.8 – ₹3.2
- De-rated P/E Multiple: 15–18×
Implied Share Price by 2026:
- ₹45 – ₹60
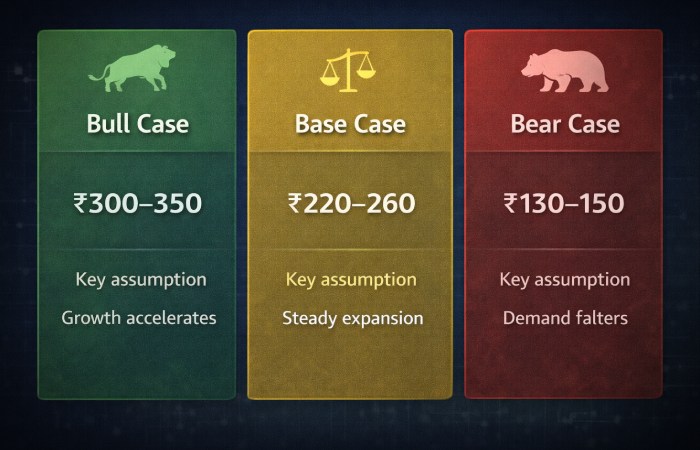
In this scenario, even moderate earnings growth fails to prevent downside, as the stock undergoes valuation correction from elevated levels.
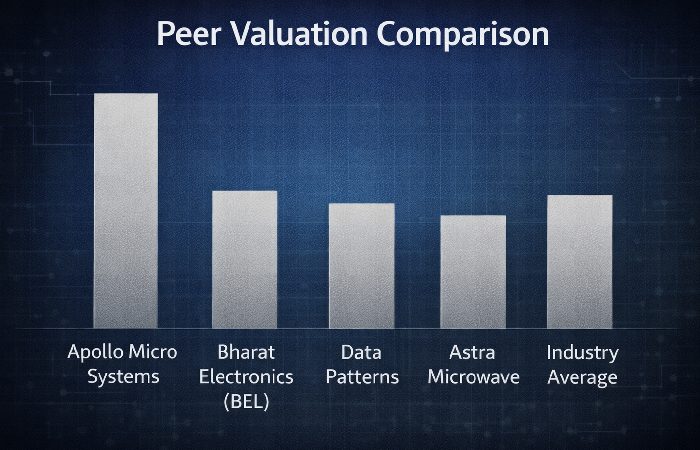
## Valuation Comparison With Other Indian Defence Stocks
| Company | Segment | P/E (Approx) |
| Apollo Micro Systems | Defence Electronics | ~107× |
| Bharat Electronics (BEL) | Defence PSU | 35–40× |
| Data Patterns | Defence Electronics | 60–65× |
| Astra Microwave | RF & Radar Systems | 45–50× |
| MTAR Technologies | Defence & Nuclear | 55–60× |
Apollo Micro Systems trades at a significantly higher valuation than its peers, despite having lower earnings visibility compared to established defence companies.
### Forward P/E Versus Earnings Growth Analysis (Illustrative Valuation Normalisation)
| Scenario | FY26 EPS | Illustrative Forward P/E (Normalised) |
| Bull Case | ₹6.8 | ~18× |
| Base Case | ₹4.4 | ~27× |
| Bear Case | ₹3.0 | ~40× |
The current share price largely discounts the bull-case outcome.
Note: The forward P/E calculations are illustrative and demonstrate how valuation normalises with earnings growth, independent of short-term price movements.
Only strong and consistent earnings growth can justify today’s valuation, while any shortfall may lead to sharp downside risk.
### Intrinsic Value Check: What Are DCF Models Saying?
Several intrinsic value and DCF-based tools currently estimate Apollo Micro Systems’ fair value in a much lower band, broadly in the ₹35–₹150 per share range depending on the model and assumptions used. Even if we treat the most conservative DCF outputs as rough guides rather than precise targets, they still imply that the current ₹250+ price bakes in several years of strong execution and growth upfront.
In other words, the market is willingly paying a “valuation premium” for Apollo’s defence positioning, DRDO-linked opportunities, and niche dominance in electronic fuses, rather than for its reported earnings today. The key question for investors is whether Apollo can actually grow into this premium fast enough through sustained revenue growth, margin resilience, and better cash flows.
### Why The Market Still Pays a Premium
Despite the apparent overvaluation on intrinsic value models, the market continues to assign a triple‑digit P/E multiple because of three main expectations:
-
A multi‑year defence capex cycle where Apollo remains a key beneficiary across fuses, underwater systems, and allied electronics.
-
Strong operating leverage as the new facilities and DRDO technology transfers scale, potentially driving faster EPS growth than current ratios suggest.
-
The scarcity value of specialised defence electronics plays in India, which pushes investors to pay up for limited listed options.
If any of these pillars weaken, the share price is likely to move closer to intrinsic value estimates; if they materialise fully, the current premium may look more reasonable in hindsight.
## Current Data & Trends: The Valuation Reality
The market has rewarded Apollo’s growth with a massive re-rating. Below is the snapshot of the company’s financial health as we head into FY2027.
Table 1: Key Financial Metrics (Jan 2026)
| Metric | Value | Comment |
| Current Price | ₹253.20 | Near 52-week high of ₹354.70 |
| P/E Ratio (TTM) | 107.54x | Significantly above industry average |
| Market Cap | ~₹9,046 Cr | Mid-cap status achieved |
| Revenue Growth | 51.28% | Outpacing 3-year CAGR of 31.93% |
| Book Value | ₹37.12 | Trading at ~6.8x Price-to-Book |
Interpretation: Table 1 shows that investors are paying ₹107.54 for every ₹1 of profit. This “Growth Penalty” is common in high-potential sectors, but the gap between the 51% revenue growth and the triple-digit P/E ratio suggests the market has already priced in several years of future success.
### Cash Flow vs Reported Profits: A Structural Risk Investors Must Watch
While Apollo Micro Systems has reported strong profit growth, operating cash flow has lagged earnings due to high working capital intensity typical of defence contracts. Long receivable cycles and inventory build-up mean profits are often realised on paper before cash is collected.
This creates a key risk: rapid growth may require external funding through debt or equity, which can dilute returns if execution timelines slip. Investors should track cash flow from operations alongside revenue growth, not profits alone.
### Comparative Analysis: The Premium Problem
To understand if Apollo is “expensive,” we must compare it to its closest listed peers in the private defense space.
Table 2: Peer Valuation Comparison
| Company | P/E Ratio (TTM) | Market Cap | Primary Moat |
| Apollo Micro Systems | 107.54x | ₹9,046 Cr | Electronic Fuses & Underwater Systems |
| Paras Defence | 77.9x | ~₹4,500 Cr | Defence Optics & EMP Protection |
| Data Patterns | 63.0x | ~₹16,000 Cr | Electronic Warfare & Radar |
| Astra Microwave | ~65.0x | ~₹8,500 Cr | RF & Microwave Systems |
Interpretation: Apollo trades at a 41% premium to Paras Defence and a 75% premium to Data Patterns. This is the critical “Valuation Gap.” While Data Patterns has a larger scale, Apollo is commanded a higher valuation multiple. Why? The answer lies in its specific niche dominance (Electronic Fuses) which we analyze in the next section. However, for a value investor, Data Patterns represents a “safer” entry into the same thematic play.
## Expert Evidence & Authority
Analysts remain divided between the “overvalued” metrics and the “structural growth” narrative.
- Bull Case: The consensus suggests that as recent large orders—including a ₹150 Crore contract win by its subsidiary—turn into revenue, the P/E will naturally compress.
- Momentum View: Small-cap tracking suggests upside potential if the defense capex cycle continues its anticipated growth, supported by the recent allotment of 22,988 sqm of land in Hyderabad for a new ₹300 Crore facility as per NSE filings.
- Bear Case: Conservative estimates warn of a potential correction to ₹200, citing the high debtor days (155 days) and the risk of execution delays in government contracts.
## Retail Momentum vs Institutional Caution
Despite exceptional past returns, institutional ownership remains relatively modest compared to large defence peers. This reflects a divergence in perception: retail investors are driven by growth momentum and thematic defence exposure, while institutions remain cautious due to valuation, cash-flow visibility, and governance risks such as working capital stress and promoter pledging.
This gap explains both the stock’s sharp rallies and its heightened volatility.
## Original Analysis: The “Electronic Fuse” Moat
Most generic analysis stops at “Defense Stocks are rising.” But the specific driver for Apollo is its mastery of Electronic Fuses.
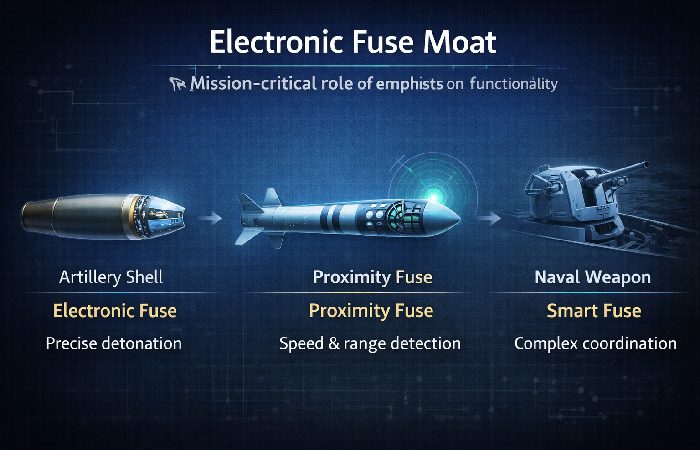
A fuse is the brain of a munition—it decides when and how a weapon detonates (impact, proximity, or time delay).
- The Moat: Developing a fuse that survives being fired from a cannon (thousands of Gs of force) and still operates with millisecond precision is incredibly difficult.
- The shift: India is aggressively replacing imported mechanical fuses (older tech) with indigenous Electronic Fuses (Apollo’s forte).
- Why it justifies (some) premium: Unlike a one-off radar sale, fuses are consumables. Every missile or shell fired needs a new fuse. This creates a recurring revenue stream that capital equipment manufacturers (like shipbuilders) don’t have.
Fresh Insight: The recent DRDO approval for the Transfer of Technology (ToT) of Mechatronic Fuses confirms Apollo as a primary beneficiary of the indigenous replacement cycle, positioning it as a critical player in next-generation defense systems.
## Risks & Limitations
Despite the “Moat,” investors must be aware of significant risks:
- Working Capital Trap:With 155 debtor days, the company’s cash is tied up in government receivables. High growth consumes cash; if payments are delayed, equity dilution might be needed.
- Valuation Compression:If quarterly growth dips below 25%, the P/E could rapidly de-rate from 110x to 60x, effectively halving the stock price even if the company is profitable.
### Promoter Share Pledging: An Amplifier of Downside Risk
Promoters have pledged a significant portion of their shareholding (around one-third). While pledging is not uncommon in capital-intensive businesses, high pledging combined with elevated valuations increases downside risk.
If the stock corrects sharply, margin calls could force additional share sales, adding pressure during market downturns. Investors should monitor promoter pledging trends closely, especially in volatile phases.
## Actionable Takeaways
- For the Aggressive Investor: Apollo offers higher beta than Data Patterns. If you believe the “Electronic Fuse” recurring revenue thesis, a dip to ₹220-230 is a strong accumulation zone.
- For the Conservative Investor: The 107.54x P/E is hard to justify. Data Patterns (63x P/E) offers similar growth exposure with a cleaner balance sheet and lower valuation risk.
- The 2026 Verdict: Expect volatility. The target of ₹320 is achievable, but it requires flawless execution.
## What Must Go Right for the Bull Case to Hold
- Revenue growth sustaining above ~30%
- Stable or improving operating margins
- Timely execution of large defence orders
- Controlled working capital cycle
- No material increase in promoter pledging
## What Could Surprise Positively
While much of the discussion focuses on downside risks and valuation compression, there are also credible upside triggers that could justify a larger part of today’s premium. Faster‑than‑expected monetisation of DRDO ToT projects, particularly in electronic and mechatronic fuses, could materially lift both revenue and margins.
Large, lumpy defence orders converting to execution sooner, entry into export markets for specialised fuse and underwater systems, or inclusion in key defence/strategic indices could all expand the earnings base and broaden the investor universe.
A visible improvement in cash flows (shorter debtor days, better working capital turns) combined with a reduction in promoter pledging would further support a re‑rating, making the current valuation look less stretched over time.
## Conclusion
Apollo Micro Systems is a high-expectation stock where future returns depend entirely on execution over the next few years. The stock may deliver strong gains if aggressive growth materialises, but it carries meaningful downside risk if earnings fail to meet expectations. This makes it suitable only for investors with high risk tolerance.
## FAQs
### Q: Why is Apollo Micro Systems share price falling / volatile?
A: At 107.54x P/E, any minor news triggers profit booking, the stock is undergoing consolidation after a sharp run-up.
### Q: Is Apollo Micro Systems debt-free?
A: No, it has working capital debt due to high debtor days (155 days), typical for B2G (Business to Government) companies.
### Q: What is the target for 2030?
A: While speculative, sustaining a 25% CAGR could see market cap double by 2030, but investors should focus on execution over the next 4-6 quarters first.
Disclaimer
Investing in stocks involves risk, and prices can fluctuate. This information is for informational purposes only and should not be considered financial advice. Please consult with a qualified financial professional before making investment decisions.
Would you like to explore the company’s recent financial results or analyst forecasts for future performance?
Author Bio:
Abdul Rahman is a web publisher who curates information from reputable public sources and uses AI tools to organise and explain it in a clearer way for readers. His articles are for informational purposes only and should not replace professional advice.